The June 30, 2017 month-end performance estimate for the Horse Cove Partners Absolute Return Strategy is +1.81% net of fees1. Since the December 2010 inception of trading, the Strategy has achieved a total cumulative return of +304.69%.
Market Recap and Commentary
S&P 500 Total Return for the month of June was up 0.62%, compared to 1.41% last month and 0.26% last June. This is also lower than the long-term average of 0.91%.
The DOW and S&P 500 finished the month of June in positive territory, achieving the best first-half performance since 2013. For those of us paying attention, that is seven straight quarters of gains. This is impressive strength in the face of the realization that there may be no fiscal stimulus forthcoming this year. Growth stocks continue to far outperform value stocks, largely due to the strength of 5 large tech stocks: Facebook, Apple, Amazon, Microsoft, and Alphabet. These stocks have accounted for one-third of the gains of the S&P 500 this year.
As expected, the FED raised its target Fed Funds rate by one-quarter of a point in June. The Fed also spoke further on its plans to reduce its $4.3 trillion balance sheet. However, yield curves continue to flatten, and that is generally not a good indicator of economic health.
Volatility, as measured by the VIX, continues to trade at historic lows. Though June saw gains in the index, and a few large swings, it posted its lowest quarterly average since 2006.
Performance and Trading Update
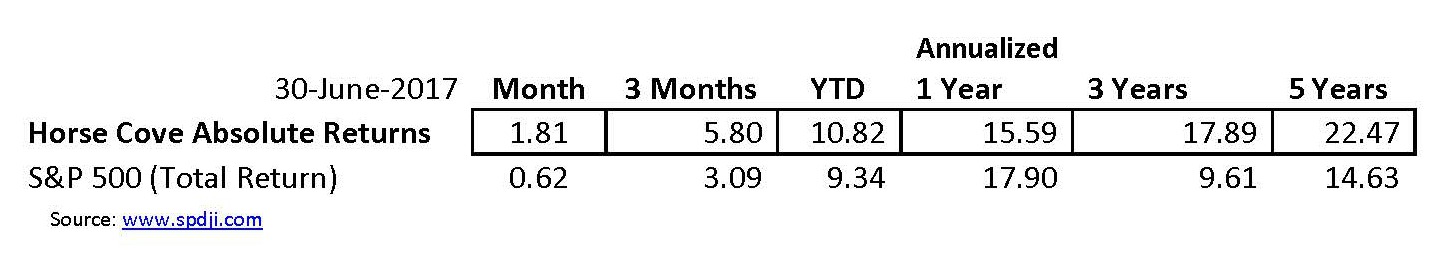
For the month, the Horse Cove Absolute Return Strategy composite return gained 1.81% compared with the S&P 500 Total Return Index which was up 0.62%.
Horse Cove Partners was able to expand our lead over the S&P 500 this year, ending June up 10.82% YTD vs. the S&P which was up 9.34%. Trading in June was relatively uneventful. We faced no pressure on our positions and trading was very “normal”.
In response to low volatility and increased margin, we began trading our condor strategy with an 80-point spread. Historically, we have used a 100-point spread, allowing us to sell one condor per $10,000 of collateral in Reg T. After extensive analysis, we determined that in the current market conditions, the additional cost of moving the protection to 80-points from 100-points is far outweighed by the benefits of the increased number of total contracts written. We feel this more efficient use of collateral may benefit our total return. We plan to continue with this plan so long as market conditions remain in their current pattern.
Here are the returns for the composite portfolio margin accounts:
Reg. T Update
Here are the composite returns for the Reg. T accounts for the periods indicated:
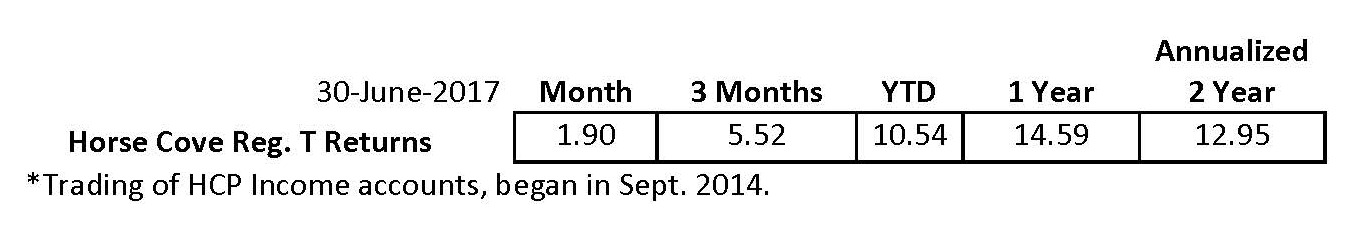
IRA accounts must use Reg. T Margin which, means that fewer option contracts can be written than in the “regular” accounts that use Portfolio Margin. Over time, this will result in lower returns when compared to the “regular” accounts.
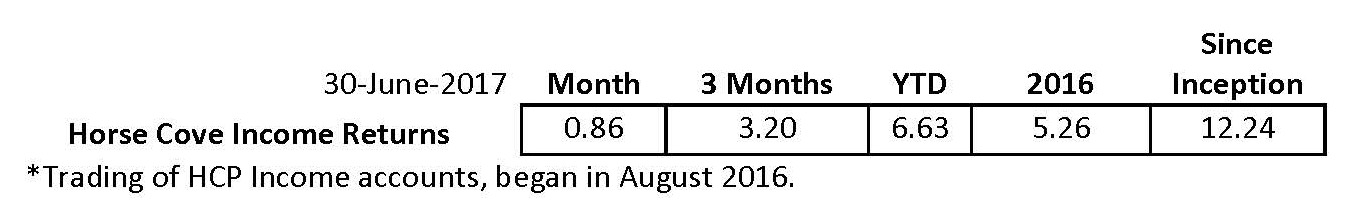
HC Income Update
Here are the composite returns for the HCP Income Strategy for the periods indicated:
Wait and See
A consistent theme in our last few newsletters has been the persistent historic lows of the VIX this year. While we saw some spikes in the index in June, the average has remained low and finished the first half of 2017 down about 20% from its year-end 2016 close. We have seen some indicators pointing to increased volatility in the future. VVIX, the CBOE VIX of VIX, has been rising and the ratio of VVIX to VIX is at its highest in nearly 10 years. At 8.2 at the end of June, the ratio is almost double where it was in March of last year.
Two of the largest ETFs designed to profit from declining volatility have experienced large outflows. These, among other factors, lead us to believe that the market is expecting a rise in volatility and the persistent low VIX we are experiencing now is due to investors waiting for something to happen - - rather than an indicator that no one has any “fear”. The S&P has been "on a tear" since the election without any meaningful corrections. The largest decline this year so far has been (-2.8%). That is the second smallest first-half decline in 89 years.
Contrast that to more than 20 new record highs so far this year. Commodities prices and bond yields continue to fall.
We are not saying the market is going to drop today, this month or even this year. We are not clairvoyant enough to know when it will correct. What we see are signs that investors are beginning to think the markets will correct. In our opinion, the current global political and economic environment does not warrant all-time low volatility, and as it rises, we will be there to collect the premium.
About Horse Cove Partners LLC
Profiting from the art and science of taking risk.®
Horse Cove Partners was founded by Sam DeKinder and Kevin Ellis in January of 2013 with the commitment to help grow clients’ assets with a highly disciplined investment strategy, replicated weekly, to extract absolute returns from the market by trading short volatility option spreads. The firm was launched after more than two years of trading experience with personal assets that began in December of 2010. The firm is built on the strength of hedge fund trading expertise developed beginning in 2002.
Assets under management at the end of June 2017 were $80.33 million.
“We do not believe we are smarter than the market, nor can we time the market in any given week or month. As a result, we take an investment approach similar to an insurance company in that our investment strategy focuses on probability of success and the management of risk. We believe that it is possible to realize positive returns through disciplined focus on the risk of each trade with a weekly investment horizon, and accepting intelligent losses when risk events occur.”
We thank you for your continued support.
Sincerely,
Sam DeKinder, Kevin Ellis
Greg Brennan
Fiona Dyer
John Monahan
Michael Crissey
Don Trotter
sdekinder@horsecovepartners.com
kellis@horsecovepartners.com
gbrennan@horsecovepartners.com
fdyer@horsecovepartners.com
jmonahan@horsecovepartners.com
mcrissey@horsecovepartners.com
dtrotter@horsecovepartners.com
Horse Cove Partners LLC
1899 Powers Ferry RD SE
Suite 120
Atlanta, GA 30339
678-905-5723 main
1Net estimate on a consolidated basis of similar accounts as of 6.30.2017, which is preliminary and subject to revision. Performance estimate described herein as “YTD” are net of fees and expenses including a 2% per year management fee and 20% incentive fee and also assumes investors have been invested with no withdrawals.
THIS MESSAGE AND ANY FILES TRANSMITTED WITH IT ARE CONFIDENTIAL AND PRIVILEGED. IF YOU ARE NOT THE INTENDED RECIPIENT, PLEASE NOTIFY THE SENDER IMMEDIATELY AT 1 (678) 905-5723. IF YOU ARE NOT THE NAMED ADDRESSEE YOU SHOULD NOT COPY OR DISCLOSE THE CONTENT OF THIS MESSAGE AND OF ANY FILES TRANSMITTED WITH IT TO ANY OTHER PERSON.
Internet communications are not secure and subject to possible data corruption, either accidentally or on purpose, and may contain viruses. The content of this message should not be construed as an investment advice unless explicitly stated as such in the text of this message. Further, this message should not be construed as the solicitation of an offer to purchase or an offer to sell any securities or other financial instruments, including, without limitation, interest in any private investment managed by Horse Cove Partners LLC or any of its affiliated entities.
Past Performance is not a guarantee of future results. Investing involves risk, including the possible loss of principal and fluctuation of value. The returns are based on the Investment Manager's strategy and not actual client accounts. The Horse Cove Absolute Return and IRA Return strategies seek to extract absolute returns from the market by trading short volatility option spreads. The strategies reflect the deduction of advisory fees and any other expenses that a client would have paid or actually paid. Model results do not represent actual trading and they may not reflect the impact that material economic and market factors might have had on the Portfolio Manager’s decision-making if the advisor were actually managing the clients' money. The S&P 500 index is used for comparative purposes only. The volatility of an index is materially different from that of the model portfolio. The S&P 500 refers to the Standard and Poor's 500 Index which is a capitalization-weighted index of 500 stocks. The index is designed to measure performance of the broad domestic stock market. The VIX (CBOE volatility index) is the ticker symbol for the Chicago Board Options Exchange (CBOE) Volatility Index, which shows the market's expectation of 30-day volatility. It is constructed using the implied volatilities of a wide range of S&P 500 index options. This volatility is meant to be forward looking and is calculated from both calls and puts. The VIX is a widely used measure of market risk and is often referred to as the "investor fear gauge." Option trading entails a high level of risk. The models do not include the reinvestment of dividends and capital gains because options don't pay dividends. Please read the Characteristics and Risks or Standardized Options available from the Options Clearing Corporation website: http://www.optionsclearing.com for further details.
IRS CIRCULAR 230 NOTICE. Any advice expressed above as to tax matters was neither written nor intended by the sender or any Horse Cove Partners LLC affiliated entities to be used and cannot be used by any taxpayer for the purpose of avoiding tax penalties that may be imposed under U.S. tax law.

