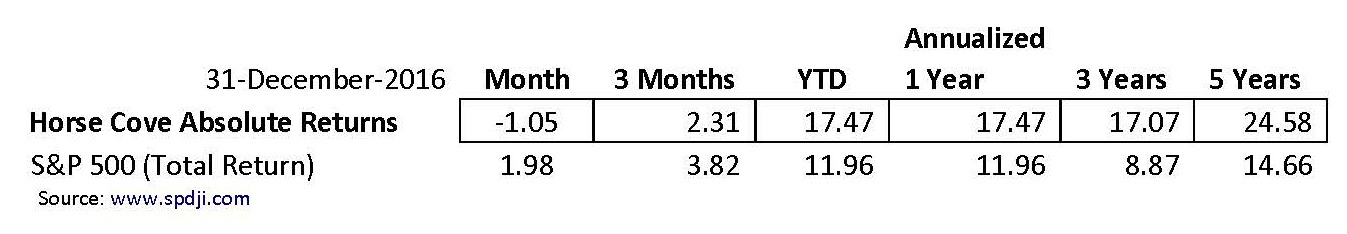
The December 31, 2016 month-end performance estimate for the Horse Cove Partners Absolute Return Strategy is -1.05% net of fees1. Since the December 2010 inception of trading, the Strategy has achieved a total cumulative return of +269.79%.
Market Recap and Commentary
The S&P 500 Total Return Index was up 1.98% for the month, and finished the year up 11.96%.
The S&P 500 index reached all-time highs in the month of December, led mostly by financials and continued positive expectations of a Trump Presidency.
As expected, we got an interest rate raise by the Fed at its December meeting.
Volatility, as measured by the (VIX), spent the entire month below 14%. The VIX has not been above 15% since November 8, 2016.
Performance and Trading Update
For the month, the Horse Cove Absolute Return Strategy composite return lost -1.05%, compared with the S&P 500 Total Return Index that was up 1.98%. Year to date, the Strategy is up 17.47% compared to the S&P 500, up 11.96%.
The VIX continues to remain at low levels, as the post-election rally continued in December. For the trading week ending on December 9, 2016, we hit our 66 2/3% rule on the calls and bought them back to close the position at a loss. Had we not, the options would have expired in the money at a significantly larger loss. We traded the rest of the month without incident, but were not able to fully recoup the first week’s loss by month end.
In the New Year, we are planning to split the portfolio and write twice a week. Approximately half to the Wednesday expiration and the remainder to the Friday expiration. There are now weekly options that expire on Monday, Wednesday, and Friday of each week. We have watched the volume grow in the Wednesday expirations, and now feel the market is sufficient to support our strategy and volume.
The advantage of the Wednesday expiration is the collateral is free to trade on Thursday morning, saving the cost of buying back both the short put and call each week to clear the collateral. (With the Friday options the collateral is not free until Monday).
Having two different expiration days and different strike prices will also allow us to spread the risk of the trade each week. When we have a loss on a trade, it may only be on half of the collateral.
Here are the returns for the composite portfolio margin accounts:
Reg. T Update
Here are the composite returns for the Reg. T accounts for the periods indicated:
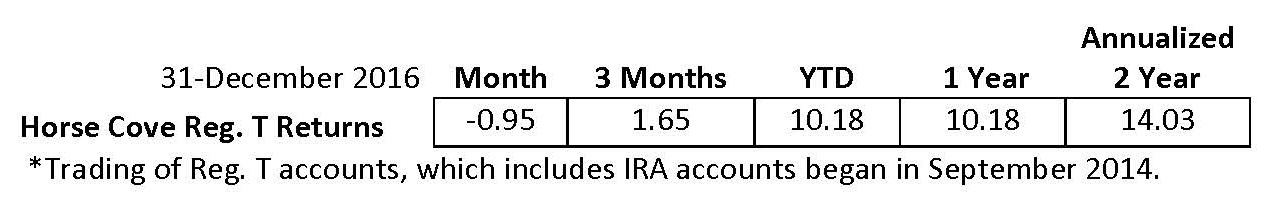
IRA accounts must use Reg. T Margin which, means that fewer option contracts can be written than in the “regular” accounts that use Portfolio Margin. Over time, this will result in lower returns when compared to the “regular” accounts.
Predictions
It is that time of the year when predictions are being made about the future and, of interest to us, are those related to the stock market. In scanning the horizon, we have found predictions of the S&P 500 delivering anywhere from plus 13.5% for the year to the markets being on the verge of a full-scale depression starting any day now.
A typical investor tries to decide where the reality may be between those two extremes and then attempts to position their portfolio to take advantage of/protect it from the likely outcome. That is a very difficult game to be successful at.
At Horse Cove Partners, our investment horizon is only a week out, give or take a day. Our underlying investment philosophy is that if the market continues to operate the way it has in the past, the trades we make have a very high probability of being profitable.
If we can limit the losses when the trades are not profitable, then over time, the number of profitable weeks will more than outweigh the losing weeks. Also, the weeks spent recouping those losses will be fewer. That will in turn deliver compelling returns to our clients. That has been the case for the past 6 years of trading and we see nothing in the market that would change our outlook for the coming year.
In 6 full years of trading our average rolling 12 month returns through December 31, 2016 are 26.06%. Our worst 12 months in that period was 8.53%. The best was 57.45%
Our prediction for 2017 is more of the same…we will strive to deliver compelling returns to our clients. Please let us know how we can help you.
About Horse Cove Partners LLC
Profiting from the art and science of taking risk.®
Horse Cove Partners was founded by Sam DeKinder and Kevin Ellis in January of 2013 with the commitment to help grow clients’ assets with a highly disciplined investment strategy, replicated weekly, to extract absolute returns from the market by trading short volatility option spreads. The firm was launched after more than two years of trading experience with personal assets that began in December of 2010. The firm is built on the strength of hedge fund trading expertise developed beginning in 2002.
Assets under management at the end of December 2016 were $42.65 million.
“We do not believe we are smarter than the market, nor can we time the market in any given week or month. As a result, we take an investment approach similar to an insurance company in that our investment strategy focuses on probability of success and the management of risk. We believe that it is possible to realize positive returns through disciplined focus on the risk of each trade with a weekly investment horizon, and accepting intelligent losses when risk events occur.”
We would like to thank you for your continued support and look forward to being in touch with you in the near future.
Sincerely,
Sam DeKinder, Kevin Ellis
Greg Brennan
John Monahan
Michael Crissey
Don Trotter
sdekinder@horsecovepartners.com
kellis@horsecovepartners.com
gbrennan@horsecovepartners.com
jmonahan@horsecovepartners.com
mcrissey@horsecovepartners.com
dtrotter@horsecovepartners.com
Horse Cove Partners LLC
1899 Powers Ferry RD SE
Suite 120
Atlanta, GA 30339
678-905-5723 main
1Net estimate on a consolidated basis of similar accounts as of 12.31.2016, which is preliminary and subject to revision. Performance estimate described herein as “YTD” are net of fees and expenses including a 2% per year management fee and 20% incentive fee and also assumes investors have been invested with no withdrawals.
THIS MESSAGE AND ANY FILES TRANSMITTED WITH IT ARE CONFIDENTIAL AND PRIVILEGED. IF YOU ARE NOT THE INTENDED RECIPIENT, PLEASE NOTIFY THE SENDER IMMEDIATELY AT 1 (978) 905 5723. IF YOU ARE NOT THE NAMED ADDRESSEE YOU SHOULD NOT COPY OR DISCLOSE THE CONTENT OF THIS MESSAGE AND OF ANY FILES TRANSMITTED WITH IT TO ANY OTHER PERSON.
Internet communications are not secure and subject to possible data corruption, either accidentally or on purpose, and may contain viruses. The content of this message should not be construed as an investment advice unless explicitly stated as such in the text of this message. Further, this message should not be construed as the solicitation of an offer to purchase or an offer to sell any securities or other financial instruments, including, without limitation, interest in any private investment managed by Horse Cove Partners LLC or any of its affiliated entities.
Past Performance is not a guarantee of future results. Investing involves risk, including the possible loss of principal and fluctuation of value. The returns are based on the Investment Manager's strategy and not actual client accounts. The Horse Cove Absolute Return and IRA Return strategies seek to extract absolute returns from the market by trading short volatility option spreads. The strategies reflect the deduction of advisory fees and any other expenses that a client would have paid or actually paid. Model results do not represent actual trading and they may not reflect the impact that material economic and market factors might have had on the Portfolio Manager’s decision-making if the advisor were actually managing the clients' money. The S&P 500 index is used for comparative purposes only. The volatility of an index is materially different from that of the model portfolio. The S&P 500 refers to the Standard and Poor's 500 Index which is a capitalization-weighted index of 500 stocks. The index is designed to measure performance of the broad domestic stock market. The VIX (CBOE volatility index) is the ticker symbol for the Chicago Board Options Exchange (CBOE) Volatility Index, which shows the market's expectation of 30-day volatility. It is constructed using the implied volatilities of a wide range of S&P 500 index options. This volatility is meant to be forward looking and is calculated from both calls and puts. The VIX is a widely used measure of market risk and is often referred to as the "investor fear gauge." Option trading entails a high level of risk. The models do not include the reinvestment of dividends and capital gains because options don't pay dividends. Please read the Characteristics and Risks or Standardized Options available from the Options Clearing Corporation website: http://www.optionsclearing.com for further details.
IRS CIRCULAR 230 NOTICE. Any advice expressed above as to tax matters was neither written nor intended by the sender or any Horse Cove Partners LLC affiliated entities to be used and cannot be used by any taxpayer for the purpose of avoiding tax penalties that may be imposed under U.S. tax law.

