The April 30, 2017 month-end performance estimate for the Horse Cove Partners Absolute Return Strategy is +1.59% net of fees1. Since the December 2010 inception of trading, the Strategy has achieved a total cumulative return of +294.01%.
Market Recap and Commentary
The S&P 500 Total Return Index was up 1.03% for the month.
Optimism continues to push markets higher, or at least not let them fall. The bull has charged through a delay in healthcare reform, at a minimum, a delay in tax reform, and is seeming to ignore the potential geopolitical problems we are facing. The 12-month forward PE on the S&P 500 has climbed to 17.6, the highest since 2004.
The S&P stayed in a relatively tight range for the first three weeks of April, with its strongest reaction going to the outcome of the first round of French elections. Apparently, the world was very happy with the two candidates left standing. All the markets gain this month came in the last week of trading. Volatility, on the other hand, had been steadily climbing early in the month into the election, and collapsed after the results, spending the second half of the month hovering between 10 and 11. The intra-day high for the month was 16.28% and the low was 10.22%. The VIX has seen extended low periods before: in the mid-1990’s, and 2005 thru 2007 leading up to the financial crisis in 2008. Looking forward to May, we expect some progress on the French elections and the healthcare and tax reforms. There is also the Fed meeting to watch, as well as many earnings reports.
Performance and Trading Update
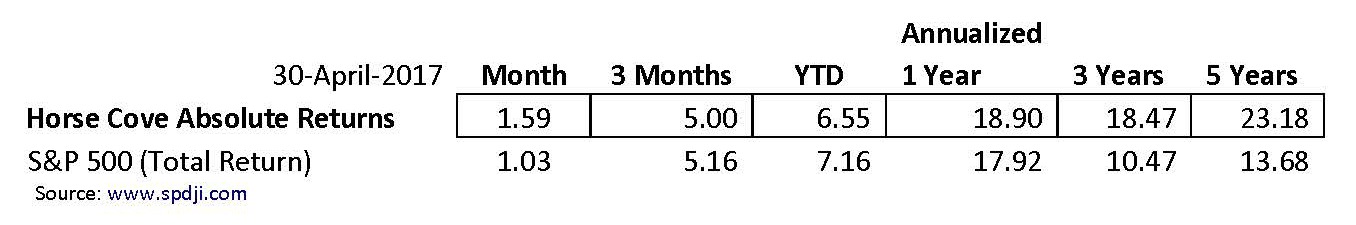
For the month, the Horse Cove Absolute Return Strategy composite return gained 1.59% compared with the S&P 500 Total Return Index that was up 1.03%.
The VIX had been climbing this month. We earned solid premium in the first few weeks and were able to earn outsized premium selling against the outcome of the French election. Even with the rally post-election, we faced no significant collateral pressure. Flexing the “art” of our strategy, we decided to buy back the calls earlier and at a higher price than we normally would to take that risk off the table just after the election. The VIX collapsed on Monday, the first day of trading after the results. Even with the VIX at historically low levels, potential outlier events such as a government shutdown, or a faceoff with North Korea kept premiums solidly average.
Here are the returns for the composite portfolio margin accounts:
Reg. T Update
Here are the composite returns for the Reg. T accounts for the periods indicated:
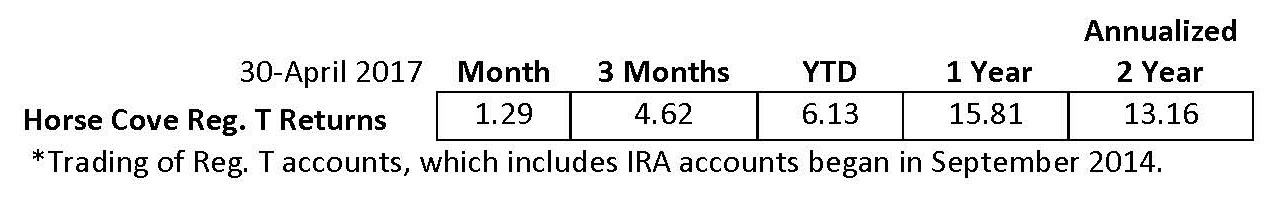
IRA accounts must use Reg. T Margin which, means that fewer option contracts can be written than in the “regular” accounts that use Portfolio Margin. Over time, this will result in lower returns when compared to the “regular” accounts.
HC Income Update
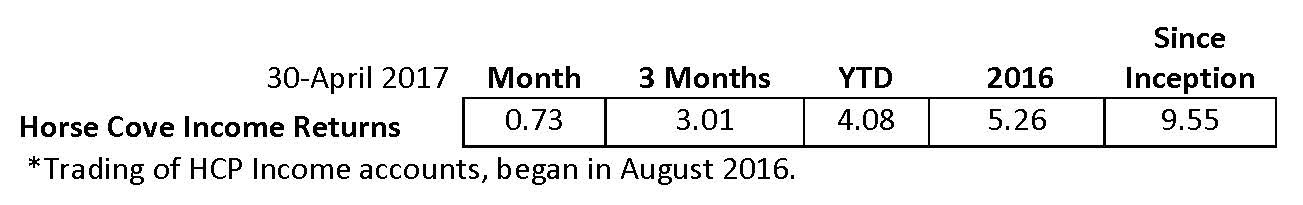
Here are the composite returns for the HCP Income Strategy for the periods indicated:
"Danger! Danger Will Robinson!" The Robot - Lost in Space
As you have undoubtedly noticed, either from the news or from your brokerage statements, the markets have been going up. For a long while. Here at home, and across the globe, stock markets have been notching all-time highs seemingly oblivious to the geopolitical concerns, dramatic elections, viruses, Brexit, terrorist attacks, etc. Stocks have appeared to price in an extremely successful business-friendly administration in the U.S., and have yet to truly flinch as that the new administration has faced some headwinds in enacting its agenda.
If you have been reading our newsletter for any period of time, you know well that we do not predict what the market will do. In our opinion, no one can do that with consistency. So why are we writing what seems to be a set up for predicting a market drop? Because we know it will correct, at some point. The one thing we do know is that the market goes up and it goes down. We just don’t know when. This is why we believe our strategy is positioned for this exact time.
Markets may continue their historic march upwards. Many argue that there is plenty of room to go, that valuations aren’t that high if you factor in low interest rates or exclude energy. That any dramatic success by President Trump will add more fuel. The largest companies in the S&P 500 are sitting on a ton of cash. All seemingly pointing to higher highs. For the last 5 years, Horse Cove has materially outperformed the S&P 500, with a standard deviation similar to a Large Cap growth mutual fund. So far this year, during the U.S. post-election rally, we have captured over 90% of the upside of the market. A very solid place to be if you want to take part in the continued rise, but are unsure when it will end.
Markets may correct. Yes, it’s true…eventually, something will cause this market to pull back. We have no idea when, or what will be the cause, but we are fairly certain it will happen. Should earnings disappoint, the Fed hikes rates faster, or war, or terror events happen, tax or healthcare reforms stall or something else we are not even seeing yet. This is when we shine. Our 5-year trailing Downside Market Capture is -115.16% as calculated by Evestment Alliance LLC. Downside Market Capture is a measure of how a manager performs relative to an index. A ratio of 80%, for example, indicates that a manager only declined 80% of the drop in the Index when the index was down.
At -115.16% the Horse Cove Partners Absolute Return Strategy goes up when the market goes down. The 5 year trailing return of the strategy is +29.01% when the S&P 500 Index is negative.
Why Horse Cove? Why now? Because we know the markets will correct eventually, whether it is 3 months or 3 years. Because no one wants to miss the upside as the markets continue to climb. Because bonds are expensive and rates are rising. Because we all want our money to work as hard as we do, and no one knows exactly when this ship will change course.
About Horse Cove Partners LLC
Profiting from the art and science of taking risk.®
Horse Cove Partners was founded by Sam DeKinder and Kevin Ellis in January of 2013 with the commitment to help grow clients’ assets with a highly disciplined investment strategy, replicated weekly, to extract absolute returns from the market by trading short volatility option spreads. The firm was launched after more than two years of trading experience with personal assets that began in December of 2010. The firm is built on the strength of hedge fund trading expertise developed beginning in 2002.
Assets under management at the end of April 2017 were $64.32 million.
“We do not believe we are smarter than the market, nor can we time the market in any given week or month. As a result, we take an investment approach similar to an insurance company in that our investment strategy focuses on probability of success and the management of risk. We believe that it is possible to realize positive returns through disciplined focus on the risk of each trade with a weekly investment horizon, and accepting intelligent losses when risk events occur.”
We thank you for your continued support.
Sincerely,
Sam DeKinder, Kevin Ellis
Greg Brennan
John Monahan
Michael Crissey
Don Trotter
sdekinder@horsecovepartners.com
kellis@horsecovepartners.com
gbrennan@horsecovepartners.com
jmonahan@horsecovepartners.com
mcrissey@horsecovepartners.com
dtrotter@horsecovepartners.com
Horse Cove Partners LLC
1899 Powers Ferry RD SE
Suite 120
Atlanta, GA 30339
678-905-5723 main
1Net estimate on a consolidated basis of similar accounts as of 4.30.2017, which is preliminary and subject to revision. Performance estimate described herein as “YTD” are net of fees and expenses including a 2% per year management fee and 20% incentive fee and also assumes investors have been invested with no withdrawals.
THIS MESSAGE AND ANY FILES TRANSMITTED WITH IT ARE CONFIDENTIAL AND PRIVILEGED. IF YOU ARE NOT THE INTENDED RECIPIENT, PLEASE NOTIFY THE SENDER IMMEDIATELY AT 1 (678) 905 5723. IF YOU ARE NOT THE NAMED ADDRESSEE YOU SHOULD NOT COPY OR DISCLOSE THE CONTENT OF THIS MESSAGE AND OF ANY FILES TRANSMITTED WITH IT TO ANY OTHER PERSON.
Internet communications are not secure and subject to possible data corruption, either accidentally or on purpose, and may contain viruses. The content of this message should not be construed as an investment advice unless explicitly stated as such in the text of this message. Further, this message should not be construed as the solicitation of an offer to purchase or an offer to sell any securities or other financial instruments, including, without limitation, interest in any private investment managed by Horse Cove Partners LLC or any of its affiliated entities.
Past Performance is not a guarantee of future results. Investing involves risk, including the possible loss of principal and fluctuation of value. The returns are based on the Investment Manager's strategy and not actual client accounts. The Horse Cove Absolute Return and IRA Return strategies seek to extract absolute returns from the market by trading short volatility option spreads. The strategies reflect the deduction of advisory fees and any other expenses that a client would have paid or actually paid. Model results do not represent actual trading and they may not reflect the impact that material economic and market factors might have had on the Portfolio Manager’s decision-making if the advisor were actually managing the clients' money. The S&P 500 index is used for comparative purposes only. The volatility of an index is materially different from that of the model portfolio. The S&P 500 refers to the Standard and Poor's 500 Index which is a capitalization-weighted index of 500 stocks. The index is designed to measure performance of the broad domestic stock market. The VIX (CBOE volatility index) is the ticker symbol for the Chicago Board Options Exchange (CBOE) Volatility Index, which shows the market's expectation of 30-day volatility. It is constructed using the implied volatilities of a wide range of S&P 500 index options. This volatility is meant to be forward looking and is calculated from both calls and puts. The VIX is a widely used measure of market risk and is often referred to as the "investor fear gauge." Option trading entails a high level of risk. The models do not include the reinvestment of dividends and capital gains because options don't pay dividends. Please read the Characteristics and Risks or Standardized Options available from the Options Clearing Corporation website: http://www.optionsclearing.com for further details.
IRS CIRCULAR 230 NOTICE. Any advice expressed above as to tax matters was neither written nor intended by the sender or any Horse Cove Partners LLC affiliated entities to be used and cannot be used by any taxpayer for the purpose of avoiding tax penalties that may be imposed under U.S. tax law.

