The August 31, 2017 month-end performance estimate for the Horse Cove Partners Absolute Return Strategy is 2.18% net of fees1. Since the December 2010 inception of trading, the Strategy has achieved a total cumulative return of +325.51%.
Total assets under management as of August 31, 2017 - $110.81 million.
Market Recap and Commentary
S&P 500 Total Return for the month of August was up 0.31%. This marks the 9th consecutive positive month for the index, saved by two days of strong gains at the end of the month. There has been only one negative month in the last 17, and the streak without a 5% correction continues to grow.
August saw a cooling of the post-election rally with the major indexes and global equity markets posting mixed results. Hurricane Harvey impacted the energy markets and increasing geopolitical tensions with North Korea resulted in a couple of 1% down days last month. The S&P 500 Index was negative for the month heading into the last few trading days, when “buy the dip” took over and turned the index positive for the month.
The FED seems intent on staying the course, with “experts” split on the likelihood of another rate hike this year.
The VIX saw a few days of significant movement, jumping to over 14 twice in August, and reaching its highest level since the November election. Neither of these “spikes” was long lived and VIX returned to its historic lows of around 10% by the end of the month.
One would think the threat of nuclear war, historically high stock prices, dysfunction in the US government and a FED determined to raise rates and reduce its balance sheet would lead to more sustained higher volatility. But, we are not in the business of predicting the market so we stick to our strategy.
Performance and Trading Update
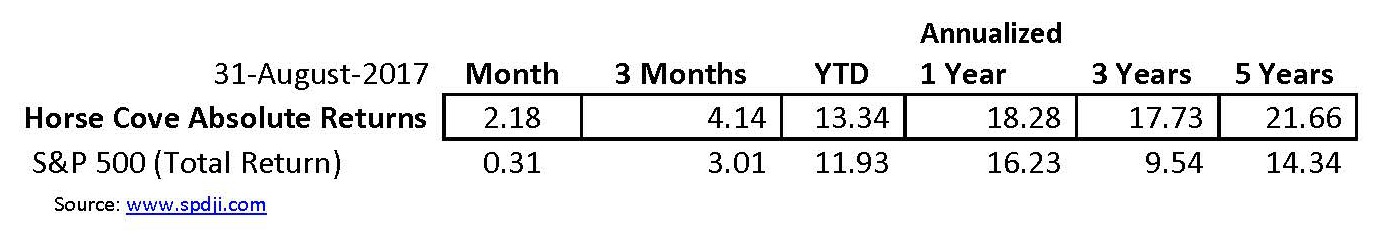
For the month, the Horse Cove Absolute Return Strategy composite gained 2.18% compared with the S&P 500 Total Return Index which was up 0.31%.
Horse Cove Partners capitalized on a few rallies in volatility helping us with returns. Fears of what could happen in North Korea seem most responsible for the sharp down days in the S&P 500 in August.
We continue to trade an 80-point spread for expirations on Wednesdays and Fridays. In expectation of continued strong growth in AUM, we are also currently tracking trading of the Monday expiration.
Here are the returns for the composite portfolio margin accounts:
Reg. T Update
Here are the composite returns for the Reg. T accounts for the periods indicated:
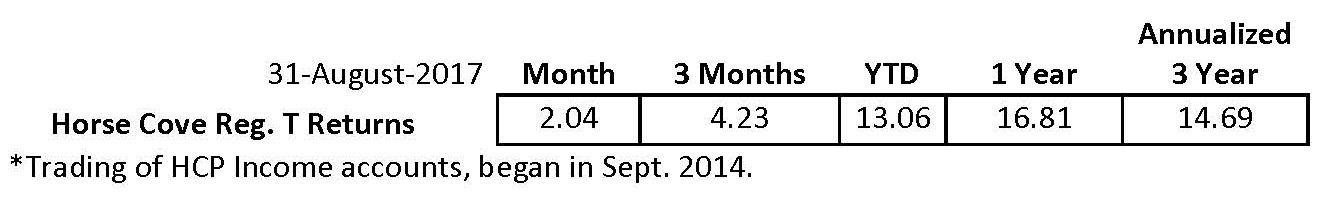
IRA accounts must use Reg. T Margin which, means that fewer option contracts can be written than in the “regular” accounts that use Portfolio Margin. Over time, this will result in lower returns when compared to the “regular” accounts.
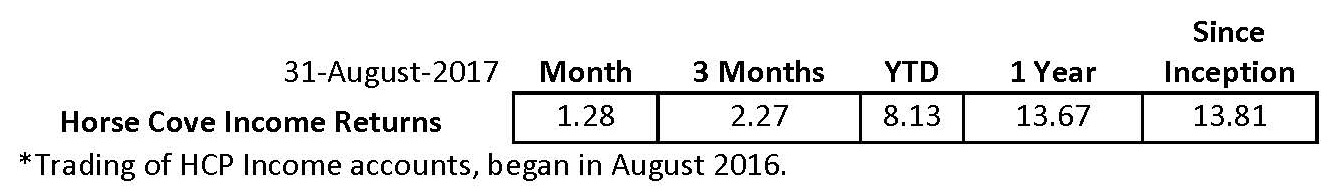
HC Income Update
Here are the composite returns for the HCP Income Strategy for the periods indicated:
The Elusive Catalyst
August trading seemed to indicate that investors are searching for a catalyst for breakout movement.The S&P 500 Index has stayed within 1% of its 50-day moving average for 17 days, tying the longest streak since 1995. So far, none of the potential headwinds have fully materialized and the fear of them doing so has not been strong enough to put the brakes on the “bull.” For every talking head urging “risk-off,” there are two that say this bull has plenty more room to run. As proven by over 30 all-time highs in the S&P 500 for 2017, investors are still in the “buy the dip” mentality. This behavior continues to soften and shorten any spikes in VIX. To the upside, positive earnings and relatively solid economic reports have also yet to push the market out of this 1% range.
As investors await this “catalyst” that will signal the market’s next major direction, we believe it is worth noting that while equity markets have hovered around their all-time highs; gold has rallied over $100 an ounce since July and bond yields remain historically low. In addition, real estate has staged a strong comeback over the last few years and no longer seems a bargain.
Are these to be taken as “signals” for what comes next? For those attempting to “time the market” they may very well be. If you have accepted our premise that you cannot successfully time the market over an extended period, then a non-correlated absolute return strategy that can perform in both positive and negative market environments is the place to be. While the world waits for the “signal,” we will continue to work to collect weekly income for our clients.
About Horse Cove Partners LLC
Profiting from the art and science of taking risk.®
Horse Cove Partners was founded by Sam DeKinder and Kevin Ellis in January of 2013 with the commitment to help grow clients’ assets with a highly disciplined investment strategy, replicated weekly, to extract absolute returns from the market by trading short volatility option spreads. The firm was launched after more than two years of trading experience with personal assets that began in December of 2010. The firm is built on the strength of hedge fund trading expertise developed beginning in 2002.
Assets under management at the end of August 2017 were $110.81 million.
“We do not believe we are smarter than the market, nor can we time the market in any given week or month. As a result, we take an investment approach similar to an insurance company in that our investment strategy focuses on probability of success and the management of risk. We believe that it is possible to realize positive returns through disciplined focus on the risk of each trade with a weekly investment horizon, and accepting intelligent losses when risk events occur.”
We thank you for your continued support.
Sincerely,
Sam DeKinder, Kevin Ellis
Greg Brennan
Fiona Dyer
John Monahan
Michael Crissey
Don Trotter
sdekinder@horsecovepartners.com
kellis@horsecovepartners.com
gbrennan@horsecovepartners.com
fdyer@horsecovepartners.com
jmonahan@horsecovepartners.com
mcrissey@horsecovepartners.com
dtrotter@horsecovepartners.com
Horse Cove Partners LLC
1899 Powers Ferry RD SE
Suite 120
Atlanta, GA 30339
678-905-5723 main
1Net estimate on a consolidated basis of similar accounts as of 8.31.2017, which is preliminary and subject to revision. Performance estimate described herein as “YTD” are net of fees and expenses including a 2% per year management fee and 20% incentive fee and also assumes investors have been invested with no withdrawals.
THIS MESSAGE AND ANY FILES TRANSMITTED WITH IT ARE CONFIDENTIAL AND PRIVILEGED. IF YOU ARE NOT THE INTENDED RECIPIENT, PLEASE NOTIFY THE SENDER IMMEDIATELY AT 1 (678) 905-5723. IF YOU ARE NOT THE NAMED ADDRESSEE YOU SHOULD NOT COPY OR DISCLOSE THE CONTENT OF THIS MESSAGE AND OF ANY FILES TRANSMITTED WITH IT TO ANY OTHER PERSON.
Internet communications are not secure and subject to possible data corruption, either accidentally or on purpose, and may contain viruses. The content of this message should not be construed as an investment advice unless explicitly stated as such in the text of this message. Further, this message should not be construed as the solicitation of an offer to purchase or an offer to sell any securities or other financial instruments, including, without limitation, interest in any private investment managed by Horse Cove Partners LLC or any of its affiliated entities.
Past Performance is not a guarantee of future results. Investing involves risk, including the possible loss of principal and fluctuation of value. The returns are based on the Investment Manager's strategy and not actual client accounts. The Horse Cove Absolute Return and IRA Return strategies seek to extract absolute returns from the market by trading short volatility option spreads. The strategies reflect the deduction of advisory fees and any other expenses that a client would have paid or actually paid. Model results do not represent actual trading and they may not reflect the impact that material economic and market factors might have had on the Portfolio Manager’s decision-making if the advisor were actually managing the clients' money. The S&P 500 index is used for comparative purposes only. The volatility of an index is materially different from that of the model portfolio. The S&P 500 refers to the Standard and Poor's 500 Index which is a capitalization-weighted index of 500 stocks. The index is designed to measure performance of the broad domestic stock market. The VIX (CBOE volatility index) is the ticker symbol for the Chicago Board Options Exchange (CBOE) Volatility Index, which shows the market's expectation of 30-day volatility. It is constructed using the implied volatilities of a wide range of S&P 500 index options. This volatility is meant to be forward looking and is calculated from both calls and puts. The VIX is a widely used measure of market risk and is often referred to as the "investor fear gauge." Option trading entails a high level of risk. The models do not include the reinvestment of dividends and capital gains because options don't pay dividends. Please read the Characteristics and Risks or Standardized Options available from the Options Clearing Corporation website: http://www.optionsclearing.com for further details.
IRS CIRCULAR 230 NOTICE. Any advice expressed above as to tax matters was neither written nor intended by the sender or any Horse Cove Partners LLC affiliated entities to be used and cannot be used by any taxpayer for the purpose of avoiding tax penalties that may be imposed under U.S. tax law.

