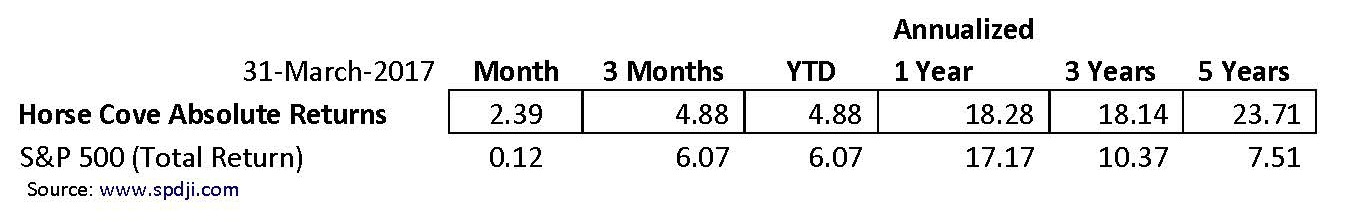
The March 31, 2017 month-end performance estimate for the Horse Cove Partners Absolute Return Strategy is +2.39% net of fees1. Since the December 2010 inception of trading, the Strategy has achieved a total cumulative return of +287.84%.
Market Recap and Commentary
The S&P 500 Total Return Index was up 0.12% for the month.
Markets notched out small gains for the month of March but gave us at least a pause in the historic march upwards. We saw one of the longest streaks without a 1% pullback in the S&P come to an end on Tuesday, March 21.
The selloff, accompanied by a sharp rise in volatility, and the uncertainty about the vote for “Trump Care” allowed us to collect solid premiums for the month. We made it through the month with no significant pressure on any of our positions. The market seemed to digest the Fed rate hike in stride as expected.
Volatility, as measured by the (VIX), continues to average historic low levels. We did see an intraday high over 14 on March 24 and over 15 on March 27, however, the index fell both days to close below 13.
Performance and Trading Update
For the month, the Horse Cove Absolute Return Strategy composite return gained 2.39% compared with the S&P 500 Total Return Index that was up 0.12%.
The lack of sellers in this bull market continues to thwart any attempt for the market to have a significant correction. This has kept VIX low and the demand for protection light.
We were able to deliver solid returns this month by using both the art and the science that is our business. Seeing an opportunity around the pullback and the anxiety over the vote for Trump Care, we moved swiftly to capture the outsized premium being offered. It did not hang around too long.This combined with 3 other solid weeks led to a good month, handily beating the S&P 500 for the month closing the gap for the quarter.
We continue to trade at the $10,000 collateral level, and have so far been unaffected by IB’s increased stressing on the portfolio.
Here are the returns for the composite portfolio margin accounts:
Reg. T Update
Here are the composite returns for the Reg. T accounts for the periods indicated:
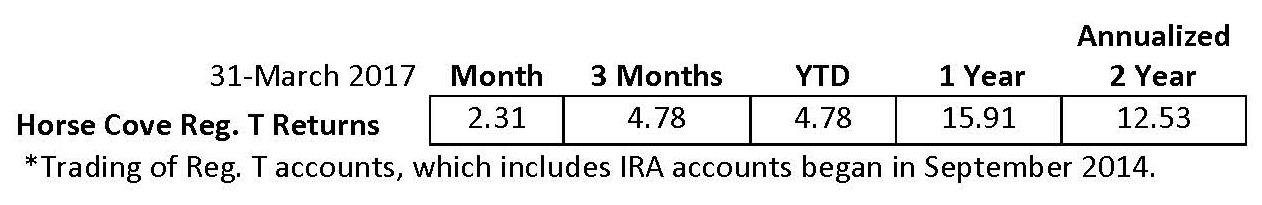
IRA accounts must use Reg. T Margin which, means that fewer option contracts can be written than in the “regular” accounts that use Portfolio Margin. Over time, this will result in lower returns when compared to the “regular” accounts.
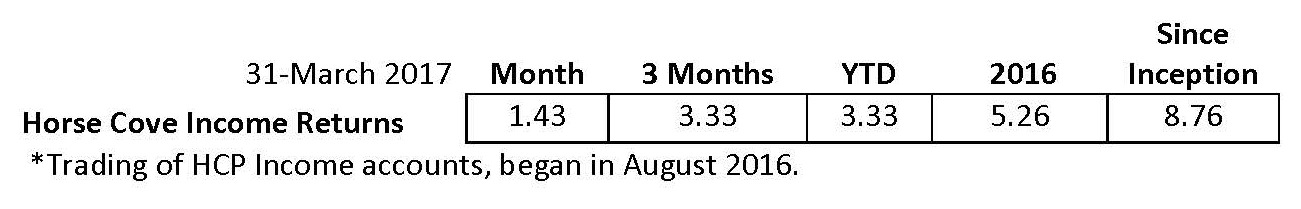
HC Income Update
Here are the composite returns for the HCP Income Strategy for the periods indicated:
VIX - Implied and Realized Volatility
Volatility as measured by the VIX, has only touched over 14% twice intra-day in 2017 and not over 20% since just before the election. Compare that to the long-term historical average of 19.98%. We refer to the VIX a lot because it is one of the key elements used in calculating the statistical probability of the options we sell. Further, it is a critical component of the pricing of S&P 500 Index options.
VIX is calculated from a complex formula with the main input being the pricing of S&P 500 index options. They are tallied to produce a VIX number, which is a measure of expected or implied volatility. Generally speaking, the market assumes the future will be a lot like the past.
As the market rises, realized volatility declines and as a result implied volatility is drawn lower. As the market declines, realized volatility rises and as a result, implied volatility is drawn higher. It is not, however, a perfect match. There is a built-in spread, if you will, between realized and implied that compensates the seller for taking on the risk. The returns for Horse Cove Partners Absolute Returns Strategy is in part from finding and capturing that spread.
Inside the relationship of implied versus realized volatility is another phenomenon which is fear. Fear still plays a role in how options are priced. As a result, you cannot look solely to implied volatility as a forecast of what premiums you will get as a seller of S&P 500 Index options. While it is generally true that low volatility translates to lower premiums and higher volatility into higher premiums, there is a very wide spread. In the last 4 years with volatility at 13%, we have sold weekly options for a total of $0.25 up to $1.35, the average being about $0.70 for both puts and calls.
To make it “perfectly clear”: looking back at actual realized volatility plays a role in the measure of implied volatility. Looking forward at the fear or the lack thereof, combined with implied volatility determines the pricing of options. The point is this: What Horse Cove Partners does is simple but it is not easy.
About Horse Cove Partners LLC
Profiting from the art and science of taking risk.®
Horse Cove Partners was founded by Sam DeKinder and Kevin Ellis in January of 2013 with the commitment to help grow clients’ assets with a highly disciplined investment strategy, replicated weekly, to extract absolute returns from the market by trading short volatility option spreads. The firm was launched after more than two years of trading experience with personal assets that began in December of 2010. The firm is built on the strength of hedge fund trading expertise developed beginning in 2002.
Assets under management at the end of March 2017 were $61.88 million.
“We do not believe we are smarter than the market, nor can we time the market in any given week or month. As a result, we take an investment approach similar to an insurance company in that our investment strategy focuses on probability of success and the management of risk. We believe that it is possible to realize positive returns through disciplined focus on the risk of each trade with a weekly investment horizon, and accepting intelligent losses when risk events occur.”
We thank you for your continued support.
Sincerely,
Sam DeKinder, Kevin Ellis
Greg Brennan
John Monahan
Michael Crissey
Don Trotter
sdekinder@horsecovepartners.com
kellis@horsecovepartners.com
gbrennan@horsecovepartners.com
jmonahan@horsecovepartners.com
mcrissey@horsecovepartners.com
dtrotter@horsecovepartners.com
Horse Cove Partners LLC
1899 Powers Ferry RD SE
Suite 120
Atlanta, GA 30339
678-905-5723 main
1Net estimate on a consolidated basis of similar accounts as of 3.31.2017, which is preliminary and subject to revision. Performance estimate described herein as “YTD” are net of fees and expenses including a 2% per year management fee and 20% incentive fee and also assumes investors have been invested with no withdrawals.
THIS MESSAGE AND ANY FILES TRANSMITTED WITH IT ARE CONFIDENTIAL AND PRIVILEGED. IF YOU ARE NOT THE INTENDED RECIPIENT, PLEASE NOTIFY THE SENDER IMMEDIATELY AT 1 (678) 905 5723. IF YOU ARE NOT THE NAMED ADDRESSEE YOU SHOULD NOT COPY OR DISCLOSE THE CONTENT OF THIS MESSAGE AND OF ANY FILES TRANSMITTED WITH IT TO ANY OTHER PERSON.
Internet communications are not secure and subject to possible data corruption, either accidentally or on purpose, and may contain viruses. The content of this message should not be construed as an investment advice unless explicitly stated as such in the text of this message. Further, this message should not be construed as the solicitation of an offer to purchase or an offer to sell any securities or other financial instruments, including, without limitation, interest in any private investment managed by Horse Cove Partners LLC or any of its affiliated entities.
Past Performance is not a guarantee of future results. Investing involves risk, including the possible loss of principal and fluctuation of value. The returns are based on the Investment Manager's strategy and not actual client accounts. The Horse Cove Absolute Return and IRA Return strategies seek to extract absolute returns from the market by trading short volatility option spreads. The strategies reflect the deduction of advisory fees and any other expenses that a client would have paid or actually paid. Model results do not represent actual trading and they may not reflect the impact that material economic and market factors might have had on the Portfolio Manager’s decision-making if the advisor were actually managing the clients' money. The S&P 500 index is used for comparative purposes only. The volatility of an index is materially different from that of the model portfolio. The S&P 500 refers to the Standard and Poor's 500 Index which is a capitalization-weighted index of 500 stocks. The index is designed to measure performance of the broad domestic stock market. The VIX (CBOE volatility index) is the ticker symbol for the Chicago Board Options Exchange (CBOE) Volatility Index, which shows the market's expectation of 30-day volatility. It is constructed using the implied volatilities of a wide range of S&P 500 index options. This volatility is meant to be forward looking and is calculated from both calls and puts. The VIX is a widely used measure of market risk and is often referred to as the "investor fear gauge." Option trading entails a high level of risk. The models do not include the reinvestment of dividends and capital gains because options don't pay dividends. Please read the Characteristics and Risks or Standardized Options available from the Options Clearing Corporation website: http://www.optionsclearing.com for further details.
IRS CIRCULAR 230 NOTICE. Any advice expressed above as to tax matters was neither written nor intended by the sender or any Horse Cove Partners LLC affiliated entities to be used and cannot be used by any taxpayer for the purpose of avoiding tax penalties that may be imposed under U.S. tax law.

