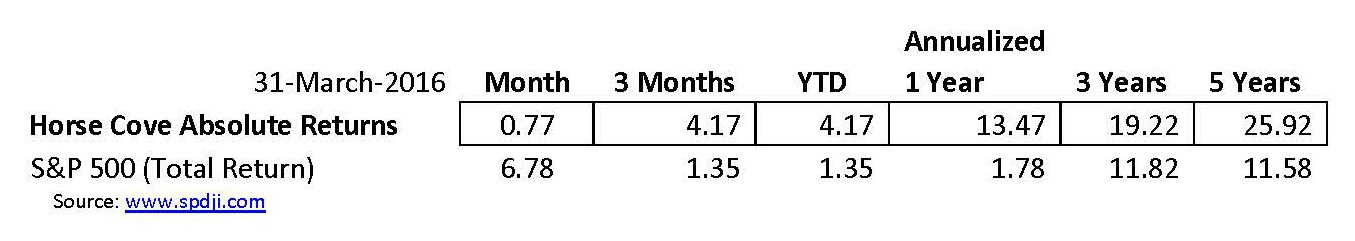
The March 31, 2016 month-end performance estimate for the Horse Cove Partners Absolute Return Strategy is 0.77% net of fees1. Since the December 2010 inception of trading, the Strategy has achieved a total cumulative return of +227.89%.
Market Recap and Commentary
The S&P 500 Total Return Index was up 6.78% for the month and in the end, returned to positive territory for the year up 1.35%.
After hitting a low in February of 1810.10, the S&P 500 Index has rocketed higher up 14.15% by the end of March. It does not appear that it will last however, as 5 days later, the S&P 500 Price Index is back in the red for the year.
Conversely, volatility as measured by the (VIX) is down 57.73% from its high on Feb. 11, 2016 at 30.90% to a low on March 30 of 13.06. For the month, volatility declined 34.2%. The last time volatility was this low, was August 17, 2015. Seven days later it hit 53.29%.
Performance and Trading Update
For the month, the Horse Cove Absolute Return Strategy composite return was up 0.77% compared to the S&P 500 Total Return Index that was up 6.78%. Year to date the Strategy is up 4.17% compared to the S&P 500 up 1.35%.
The Strategy was again challenged on the call side a couple of times this month. We did not have significant losses, but basically broke even. But that left a couple of weeks with minimal profit from the strategy on a net basis.
With falling volatility, premiums for option contracts also declined as we worked through Spring break. Surprisingly there was a marked difference in activity and appetite for options during the rolling Spring breaks for public and then private schools this month.
IRA Update
Here are the returns for the consolidated IRA accounts for the periods indicated:
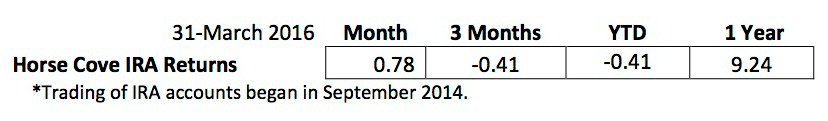
IRA accounts must use Reg. T Margin which, means that fewer option contracts can be written than in the “regular” accounts that use Portfolio Margin. Over time, this will result in lower returns when compared to the “regular” accounts.
Volatility On The Rise?
The historical average daily volatility since 1990, as measured by the VIX is 19.94%. The median is 17.98%. So with the VIX closing the month at 13.06%, can we conclude that volatility will rise? Yes, we can predict with some confidence that volatility will move higher. The more important question is when and how fast?
Volatility tends to spike up and then drift lower. We see that pattern repeated over and over. Here is a one year view of the VIX as of April 5, 2016.
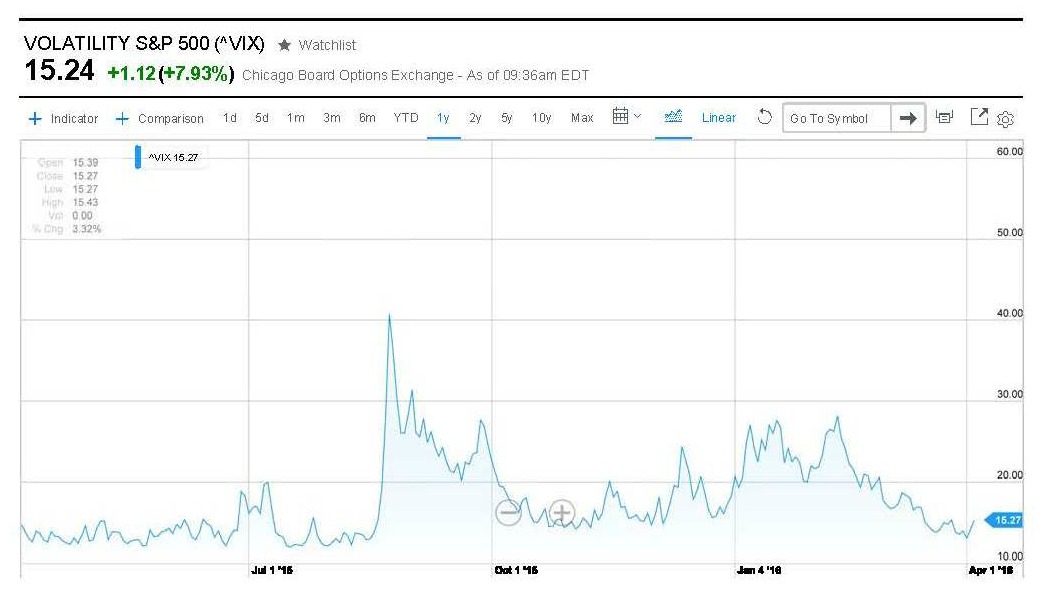
Source: http://finance.yahoo.com/echarts
You will note that the spike up in August of 2015 was followed by an extended period of time with volatility relatively high, but falling. That provides a very favorable environment for selling options.
What is not as apparent, is that the VIX can go for extended periods of time staying below 20%. While the average is about 20%, the daily closing VIX from January 1990 through December 2015 closed:
91.1% of the time below 30%
81.3% of the time below 25%
60.2% of the time below 20%; and
31.1% of the time below 15%.
From Dec. 2012 to Oct. 6, 2014 the VIX never rose above 20% for almost two years. In Oct. 2014 through Dec. of 2014, the VIX stayed below 20% for almost three months. Just before the last big spike in volatility in August of 2015, the VIX was below 20% for almost 5 months--only hitting an inter-day high of 20.05% on one day, July 9, 2015.
Lower volatility is interpreted as meaning less “fear” in the marketplace. It is also generally correlated to lower option premiums. However, there has been no news that anything has been “fixed”.
Our conclusion is that lower volatility does not mean that higher volatility is just around the corner. Nor does low volatility mean that we can relax. It does imply that for now, there are no storms directly foreseeable in the near term that options buyers want to pay nice premiums for. We know that it will not last and that higher volatility, higher than what we are currently experiencing is somewhere in the future. We will be patient and collect premiums each and every week as it changes.
About Horse Cove Partners LLC
Profiting from the art and science of taking risk.®
Horse Cove Partners was founded by Sam DeKinder and Kevin Ellis in January of 2013 with the commitment to help grow clients’ assets with a highly disciplined investment strategy, replicated weekly, to extract absolute returns from the market by trading short volatility option spreads. The firm was launched after more than two years of trading experience with personal assets that began in December of 2010. The firm is built on the strength of hedge fund trading expertise developed beginning in 2002.
Assets under management at the end of March 2016 were $21.897 million.
“We do not believe we are smarter than the market, nor can we time the market in any given week or month. As a result, we take an investment approach similar to an insurance company in that our investment strategy focuses on probability of success and the management of risk. We believe that it is possible to realize positive returns through disciplined focus on the risk of each trade with a weekly investment horizon, and accepting intelligent losses when risk events occur.”
We would like to thank you for your continued support and look forward to being in touch with you in the near future.
Sincerely,
Sam DeKinder, Kevin Ellis
John Monahan
Michael Crissey
Greg Hyde
Don Trotter
sdekinder@horsecovepartners.com
kellis@horsecovepartners.com
jmonahan@horsecovepartners.com
mcrissey@horsecovepartners.com
ghyde@horsecovepartners.com
dtrotter@horsecovepartners.com
Horse Cove Partners LLC
1899 Powers Ferry RD SE
Suite 120
Atlanta, GA 30339
678-905-5723 main
1Net estimate on a consolidated basis of similar accounts as of 3.31.2016, which is preliminary and subject to revision. Performance estimate described herein as “YTD” are net of fees and expenses including a 2% per year management fee and 20% incentive fee and also assumes investors have been invested with no withdrawals.
THIS MESSAGE AND ANY FILES TRANSMITTED WITH IT ARE CONFIDENTIAL AND PRIVILEGED. IF YOU ARE NOT THE INTENDED RECIPIENT, PLEASE NOTIFY THE SENDER IMMEDIATELY AT 1 (978) 905 5723. IF YOU ARE NOT THE NAMED ADDRESSEE YOU SHOULD NOT COPY OR DISCLOSE THE CONTENT OF THIS MESSAGE AND OF ANY FILES TRANSMITTED WITH IT TO ANY OTHER PERSON.
Internet communications are not secure and subject to possible data corruption, either accidentally or on purpose, and may contain viruses. The content of this message should not be construed as an investment advice unless explicitly stated as such in the text of this message. Further, this message should not be construed as the solicitation of an offer to purchase or an offer to sell any securities or other financial instruments, including, without limitation, interest in any private investment managed by Horse Cove Partners LLC or any of its affiliated entities.
Past Performance is not a guarantee of future results. Investing involves risk, including the possible loss of principal and fluctuation of value. The returns are based on the Investment Manager's strategy and not actual client accounts. The Horse Cove Absolute Return and IRA Return strategies seek to extract absolute returns from the market by trading short volatility option spreads. The strategies reflect the deduction of advisory fees and any other expenses that a client would have paid or actually paid. Model results do not represent actual trading and they may not reflect the impact that material economic and market factors might have had on the Portfolio Manager’s decision-making if the advisor were actually managing the clients' money. The S&P 500 index is used for comparative purposes only. The volatility of an index is materially different from that of the model portfolio. The S&P 500 refers to the Standard and Poor's 500 Index which is a capitalization-weighted index of 500 stocks. The index is designed to measure performance of the broad domestic stock market. The VIX (CBOE volatility index) is the ticker symbol for the Chicago Board Options Exchange (CBOE) Volatility Index, which shows the market's expectation of 30-day volatility. It is constructed using the implied volatilities of a wide range of S&P 500 index options. This volatility is meant to be forward looking and is calculated from both calls and puts. The VIX is a widely used measure of market risk and is often referred to as the "investor fear gauge." Option trading entails a high level of risk. The models do not include the reinvestment of dividends and capital gains because options don't pay dividends. Please read the Characteristics and Risks or Standardized Options available from the Options Clearing Corporation website: http://www.optionsclearing.com for further details.
IRS CIRCULAR 230 NOTICE. Any advice expressed above as to tax matters was neither written nor intended by the sender or any Horse Cove Partners LLC affiliated entities to be used and cannot be used by any taxpayer for the purpose of avoiding tax penalties that may be imposed under U.S. tax law.

