The April 30, 2016 month-end performance estimate for the Horse Cove Partners Absolute Return Strategy is 1.06% net of fees1. Since the December 2010 inception of trading, the Strategy has achieved a total cumulative return of +231.37%.
Market Recap and Commentary
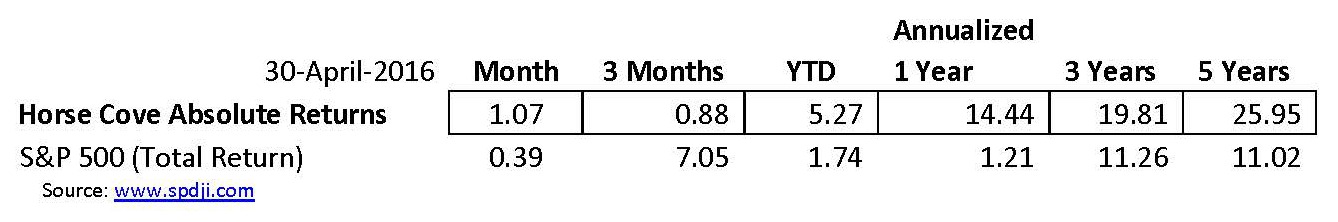
The S&P 500 Total Return Index was up 0.39% for the month and in the end, returned to positive territory for the year, up 1.74%.
Things were relatively quiet during the month. The S&P 500 opened April at 2056.62 and closed at 2065.30 only up 0.39%. The total range of the index during the month was less than 3.4%, from the inter-day low to the inter-day high. Perhaps the “calm” before we move into what is known on Wall Street as the time to “sell in May and go away”.
Volatility, as measured by the (VIX), was also pretty much range-bound during the month, trading a range of between a low of 12.50% and a high of 16.26%. We started and ended the month with volatility in the 15% range.
Performance and Trading Update
For the month, the Horse Cove Absolute Return Strategy composite return was up 1.06% compared to the S&P 500 Total Return Index that was up 0.39%. Year to date, the Strategy is up 5.27% compared to the S&P 500 up 1.74%.
This was a relatively calm month for trading the strategy. We were not forced to take any defensive action during the month. Unfortunately, premiums were slightly lower historically speaking even though volatility moved around some..
IRA Update
Here are the returns for the consolidated IRA accounts for the periods indicated:
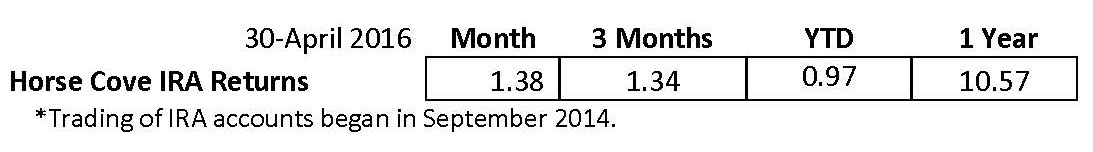
IRA accounts must use Reg. T Margin which, means that fewer option contracts can be written than in the “regular” accounts that use Portfolio Margin. Over time, this will result in lower returns when compared to the “regular” accounts.
Predictions of Low Returns From Conventional Assets
After running basically up for the last 7 years, it seems like things are going to change for the worst for conventional investments. This month, we saw two major markets “experts” reveal what they believe will be 5 years of low returns, following last year’s essentially “breakeven” performance.
In an article by John Waggoner in Investment News dated April 26, 2016, it was reported that Richard Turnhill, the Chief Global Investment Strategist for BlackRock Inc. wrote in a weekly market commentary that “We see a global portfolio made up of 60% equities and 40% fixed income producing annual returns of just 3.3% in U.S. Dollars--before inflation over the next five years”. For those that stay in the US Equities markets, things are slightly worse, predicting returns of only about 1% per year after inflation. BlackRock is a $4.6 trillion dollar company.
In a report from McKinsey Global Institute dated April 2016, titled “Why investors may need to lower their sights”, they suggest that after an era of stellar returns (the last 30 years), that investor returns are likely to be significantly lower over the next 20 years. Their prediction is that the annual returns in U.S. Equities will average between 4.0 and 6.5% over the next 20 years and the yield on U.S. Government bonds will average 1.6% per year all before considering inflation.
Similarly, the Boston based company GMO predicts returns from U.S. equities, over the next seven years will average only 2.3% per year after inflation. They are predicting holding U.S. bonds will result in losing 1.6% per year for the next seven years.
We did the math: holding a U.S. bond portfolio for the next seven years will result in a cumulative loss of (10.68%) if they are right. Such a portfolio will need to grow almost 13% in the following years to get back to breakeven. As we are focused on risk, we have to ask ourselves--what kind of risk is an investor accepting in their bond portfolio if the expected return over 7 years is to lose money versus making an investment in an absolute return strategy that is averaging over 20% per year for the last 5 1/2 years? Or put another way: after 4 months in 2016, Horse Cove has already earned its clients more money than a conventional bond manger is predicted to earn over the next 10 or more years after inflation.
About Horse Cove Partners LLC
Profiting from the art and science of taking risk.®
Horse Cove Partners was founded by Sam DeKinder and Kevin Ellis in January of 2013 with the commitment to help grow clients’ assets with a highly disciplined investment strategy, replicated weekly, to extract absolute returns from the market by trading short volatility option spreads. The firm was launched after more than two years of trading experience with personal assets that began in December of 2010. The firm is built on the strength of hedge fund trading expertise developed beginning in 2002.
Assets under management at the end of April 2016 were $22.885 million.
“We do not believe we are smarter than the market, nor can we time the market in any given week or month. As a result, we take an investment approach similar to an insurance company in that our investment strategy focuses on probability of success and the management of risk. We believe that it is possible to realize positive returns through disciplined focus on the risk of each trade with a weekly investment horizon, and accepting intelligent losses when risk events occur.”
We would like to thank you for your continued support and look forward to being in touch with you in the near future.
Sincerely,
Sam DeKinder, Kevin Ellis
John Monahan
Michael Crissey
Greg Hyde
Don Trotter
sdekinder@horsecovepartners.com
kellis@horsecovepartners.com
jmonahan@horsecovepartners.com
mcrissey@horsecovepartners.com
ghyde@horsecovepartners.com
dtrotter@horsecovepartners.com
Horse Cove Partners LLC
1899 Powers Ferry RD SE
Suite 120
Atlanta, GA 30339
678-905-5723 main
1Net estimate on a consolidated basis of similar accounts as of 4.30.2016, which is preliminary and subject to revision. Performance estimate described herein as “YTD” are net of fees and expenses including a 2% per year management fee and 20% incentive fee and also assumes investors have been invested with no withdrawals.
THIS MESSAGE AND ANY FILES TRANSMITTED WITH IT ARE CONFIDENTIAL AND PRIVILEGED. IF YOU ARE NOT THE INTENDED RECIPIENT, PLEASE NOTIFY THE SENDER IMMEDIATELY AT 1 (978) 905 5723. IF YOU ARE NOT THE NAMED ADDRESSEE YOU SHOULD NOT COPY OR DISCLOSE THE CONTENT OF THIS MESSAGE AND OF ANY FILES TRANSMITTED WITH IT TO ANY OTHER PERSON.
Internet communications are not secure and subject to possible data corruption, either accidentally or on purpose, and may contain viruses. The content of this message should not be construed as an investment advice unless explicitly stated as such in the text of this message. Further, this message should not be construed as the solicitation of an offer to purchase or an offer to sell any securities or other financial instruments, including, without limitation, interest in any private investment managed by Horse Cove Partners LLC or any of its affiliated entities.
Past Performance is not a guarantee of future results. Investing involves risk, including the possible loss of principal and fluctuation of value. The returns are based on the Investment Manager's strategy and not actual client accounts. The Horse Cove Absolute Return and IRA Return strategies seek to extract absolute returns from the market by trading short volatility option spreads. The strategies reflect the deduction of advisory fees and any other expenses that a client would have paid or actually paid. Model results do not represent actual trading and they may not reflect the impact that material economic and market factors might have had on the Portfolio Manager’s decision-making if the advisor were actually managing the clients' money. The S&P 500 index is used for comparative purposes only. The volatility of an index is materially different from that of the model portfolio. The S&P 500 refers to the Standard and Poor's 500 Index which is a capitalization-weighted index of 500 stocks. The index is designed to measure performance of the broad domestic stock market. The VIX (CBOE volatility index) is the ticker symbol for the Chicago Board Options Exchange (CBOE) Volatility Index, which shows the market's expectation of 30-day volatility. It is constructed using the implied volatilities of a wide range of S&P 500 index options. This volatility is meant to be forward looking and is calculated from both calls and puts. The VIX is a widely used measure of market risk and is often referred to as the "investor fear gauge." Option trading entails a high level of risk. The models do not include the reinvestment of dividends and capital gains because options don't pay dividends. Please read the Characteristics and Risks or Standardized Options available from the Options Clearing Corporation website: http://www.optionsclearing.com for further details.
IRS CIRCULAR 230 NOTICE. Any advice expressed above as to tax matters was neither written nor intended by the sender or any Horse Cove Partners LLC affiliated entities to be used and cannot be used by any taxpayer for the purpose of avoiding tax penalties that may be imposed under U.S. tax law.

