The September 30, 2019, month-end performance estimate for the Horse Cove Partners Absolute Return Strategy is up 2.00% net of fees1. Since the December 2010 inception of trading, the Strategy has achieved a total cumulative return of +276.91% net of fees.
Market Recap and Commentary
S&P 500 Total Return for the month of September was up 1.87%.
The S&P ended the quarter slightly ahead of where it started, and flat from January of 2018. Investor confidence appears to have been shaken by the violent swings we have been seeing in the market. The weekly count of S&P 500 stocks hitting 52-week highs has dropped by almost two-thirds from June (per data from FactSet Research Systems). Most economic data continue to point to a recession coming, exacerbated by the perception that FED rate cuts have lost their potency. If things do turn south, this would suggest that the FED would need to be even more aggressive with cuts and QE with a package similar to the one offered by Mario Draghi and the EU last month. Add to that, the continued trade war ping-pong match, the REPO market dysfunction, attacks on Saudi Arabia’s oil fields, the approaching BREXIT deadline (with no deal in place), and “collusion” part II. So, there are still plenty of things to worry about. All that being said, housing and consumer numbers have remained strong. Historically, the fourth quarter is the strongest of the year (ignore 2018).
Performance and Trading Update
Horse Cove Partners Absolute Return Strategy composite was up 2.00% net of fees in September.
Trading was successful in September through an S&P that traded between 2940 and 3030, about a 3% range with multiple violent swings in both directions. Our multi-layered approach to risk management kept us out of any real trouble during the month and allowed us to capture almost all of our premiums. The market continues to be nervous and behave as though it’s ready to transition, with headlines and news driving it sharply in one direction or, the other.
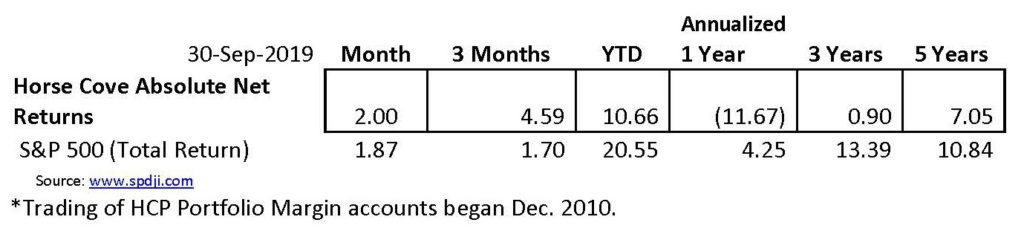
Here are the composite net returns for the Portfolio Margin accounts for the periods indicated:
Reg. T Update
Here are the composite net returns for the Reg. T accounts for the periods indicated:
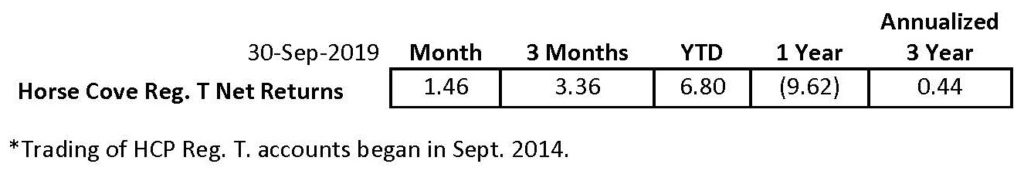
IRA accounts must use Reg. T Margin which means that fewer option contracts may be written than in the “regular” accounts that use Portfolio Margin. Over time, this may also result in lower returns when compared to the “regular” accounts.
HC Enhanced Yield Update
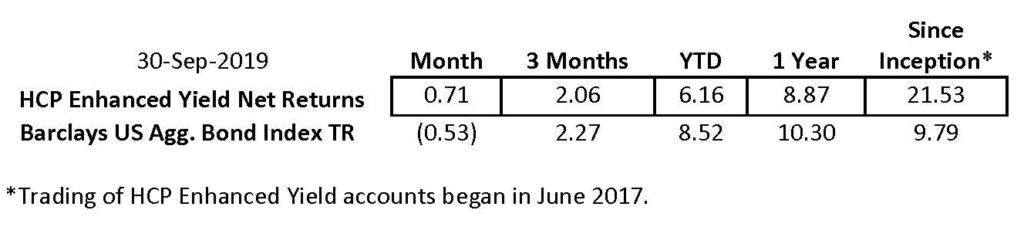
Here are the composite net returns for the Enhanced Yield Strategy for the periods indicated:
Deja Vu
It feels like we have been here before. We have. It was January of 2018, and everything was awesome. The S&P started the year strong after a record-breaking low volatility climb through 2017 resulting in a situation very close to where we are right now.
A lot has changed since then, while some things have not.
Trump is still president and still stirring the pot, and those that don’t like him are still trying to get him out of office. The UK still plans to leave the EU shortly and still has no deal. For the most part, corporate earnings continue to beat estimates, partly due to lowered expectations. The U.S. continues to be the strongest economy in the developed world and yields are still low, though relative to the rest of the world, they are the highest. Consumers (70% of US economy) are still spending, and job numbers are still extremely strong.
Our relations with China, Iran, and Russia are still not very good.
Some things have changed. The FED has done a complete 180 and instead of the 4 rate hikes expected for 2019, we are potentially looking at three cuts. Economic numbers and the bond market are increasingly pointing to a challenging road ahead. The US economy is now in the midst of the longest expansion in U.S.history. The word “recession” is now appearing in almost all financial reports and newsletters, not just the perma-bears. Over $19 trillion dollars are now invested in negative-yielding instruments, and companies/governments are no longer paying down debt, but accumulating it as fast as they can print a term sheet.
Lastly, what’s the major difference for the S&P 500? We are no longer seeing record highs every week. In fact, the S&P 500 has only posted a handful of new all-time highs this year, with the July high holding now over two months.
About Horse Cove Partners LLC
Profiting from the art and science of taking risk. ®
Horse Cove Partners was founded by Sam DeKinder and Kevin Ellis in January of 2013 with the commitment to help grow client’s assets with a highly disciplined investment strategy, replicated weekly, to extract absolute returns from the market by trading short volatility option spreads. The firm was launched after more than two years of trading experience with personal assets that began in December 2010. The firm is built on the strength of hedge fund trading expertise developed beginning in 2002.
Assets under management at the end of September 2019 were $100.32 million.
“We do not believe we are smarter than the market, nor can we time the market in any given week or month. As a result, we take an investment approach similar to an insurance company in that our investment strategy focuses on the probability of success and the management of risk. We believe that it is possible to realize positive returns through a disciplined focus on the risk of each trade with a weekly investment horizon, and accepting intelligent losses when risk events occur.”
We thank you for your continued support.
Sincerely,
Sam DeKinder, Kevin Ellis
Greg Brennan
Fiona Dyer
John Monahan
Michael Crissey
Don Trotter
sdekinder@horsecovepartners.com
kellis@horsecovepartners.com
gbrennan@horsecovepartners.com
fdyer@horsecovepartners.com
jmonahan@horsecovepartners.com
mcrissey@horsecovepartners.com
dtrotter@horsecovepartners.com
Horse Cove Partners LLC
1899 Powers Ferry RD SE
Suite 120
Atlanta, GA 30339
678-905-5723 main
1Net estimate on a consolidated basis of similar accounts as of 9.30.2019, which is preliminary and subject to revision. Performance estimate described herein as “YTD” are net of fees and expenses including a 2% per year management fee and 20% incentive fee and assumes investors have been invested the entire time with no withdrawals. Individual account returns may vary depending on cash flows, the time period assets are invested, and restrictions placed on the account.
This was prepared by Horse Cove Partners LLC a federally registered investment adviser under the Investment Advisers Act of 1940. Registration as an investment adviser does not imply a certain level of skill or training. The oral and written communications of an adviser provide you with information about which you determine to hire or retain an adviser. Additional information about our firm is also available at www.adviserinfo.sec.gov. You can view the firm’s information on this website by searching for our firm name.
THIS MESSAGE AND ANY FILES TRANSMITTED WITH IT ARE CONFIDENTIAL AND PRIVILEGED. IF YOU ARE NOT THE INTENDED RECIPIENT, PLEASE NOTIFY THE SENDER IMMEDIATELY AT 1 (678) 905 5723. IF YOU ARE NOT THE NAMED ADDRESSEE YOU SHOULD NOT COPY OR DISCLOSE THE CONTENT OF THIS MESSAGE AND ANY FILES TRANSMITTED WITH IT TO ANY OTHER PERSON.
Internet communications are not secure and subject to possible data corruption, either accidentally or on purpose, and may contain viruses. The content of this message should not be construed as investment advice unless explicitly stated as such in the text of this message. Further, this message should not be construed as the solicitation of an offer to purchase or an offer to sell any securities or other financial instruments, including, without limitation, interest in any private investment managed by Horse Cove Partners LLC or any of its affiliated entities.
This material has been prepared solely for informational purposes only. Strategies shown are speculative, involve a high degree of risk and are designed for sophisticated investors.
Past performance is not a guarantee of future results. Investing involves risk, including the possible loss of principal and fluctuation of value. The information herein was obtained from third-party sources. Horse Cove does not guarantee the accuracy or completeness of such information provided by third parties. All information is given as of the date indicated and believed to be reliable. Performance results are estimates pending a verification. The returns are based on the Investment Manager's strategy and the compilation of actual client account trades. The Horse Cove Absolute Return and IRA Return strategies seek to extract absolute returns from the market by trading short volatility option spreads. The Enhanced Yield strategy seeks to achieve a targeted return trading only puts with a high probability of success.
The strategies reflect the deduction of advisory fees and any other expenses that a client would have paid or actually paid. The S&P 500 Index is used for comparative purposes only. The volatility of an index is materially different from that of the model portfolio. The S&P 500 refers to the Standard and Poor's 500 Index which is a capitalization-weighted index of 500 stocks. The index is designed to measure the performance of the broad domestic stock market. The VIX (CBOE volatility index) is the ticker symbol for the Chicago Board Options Exchange (CBOE) Volatility Index, which shows the market's expectation of 30-day volatility. It is constructed using the implied volatilities of a wide range of S&P 500 index options. This volatility is meant to be forward-looking and is calculated from both calls and puts. The VIX is a widely used measure of market risk and is often referred to as the "investor fear gauge." Investors cannot invest directly in an index. An index does not charge management fees or brokerage expenses, and no such fees or expenses were deducted from the performance shown. Options trading entails a high level of risk. The models do not include the reinvestment of dividends and capital gains because options don't pay dividends. Please read the Characteristics and Risks of Standardized Options available from the Options Clearing Corporation website: http://www.optionsclearing.com for further details.

