The May 31, 2019, month-end performance estimate for the Horse Cove Partners Absolute Return Strategy is up 4.15% net of fees1. Since the December 2010 inception of trading, the Strategy has achieved a total cumulative return of +286.06% net of fees.
Market Recap and Commentary
S&P 500 Total Return for the month of May was a loss of (6.35%).
May was the first down month for the major averages this year, slightly halting their historic rise since the past December. The sharp pullback on news of potential tariffs with Mexico showed the hair-trigger this market has been built on. The S&P 500 has traded this year as though it hasn’t a care in the world. The facts remain unchanged from previous months.
- No progress with China on trade or Brexit.
- Moving backward with MCAA.
- Democrats have not accepted the findings from the Russia investigation and continue to threaten impeachment.
- Economic numbers are, at best, a mixed bag.
- The FED (although apparently committed to being seen as a market backstop) has far less leverage to act to support the markets. (Remember during the financial crisis in 2008 when the FED acted strongly to support markets and the economy, its balance sheet was much smaller and rates were at 5.25%.)
Market participants are now pricing in at least one rate cut this year, possibly two. The US 10-year yield curve inverted and was lower than most of its shorter-term yields, as well as below the FED’s policy rate. As we have mentioned in the past, an inverted rate curve has been a reliable predictor of recessions.
We believe there is much more downside for equities and bonds versus upside at the present time. Otherwise, the FED would not be discussing interest rate cuts and investors would not be paying European governments to take their money.
Performance and Trading Update
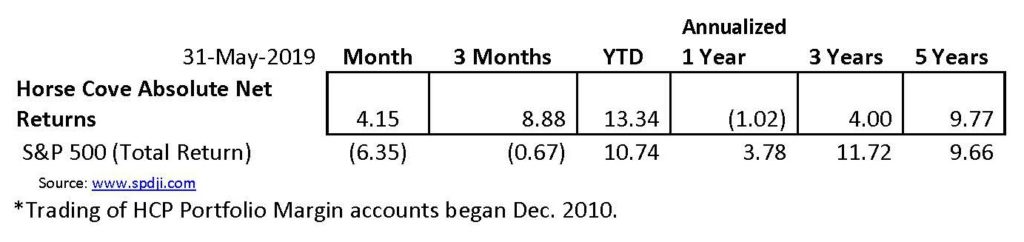
Horse Cove Partners Absolute Return Strategy composite was up 4.15% net of fees in May.
The rally in the S&P 500 that started in December took a breather in May. The S&P 500 declined for four consecutive weeks during the month. Volatility, as measured by the VIX ranged intra-day from a low of 12.74% to a high of 21.32%. The average daily closing VIX was 16.72% during the month.
Here are the composite net returns for the Portfolio Margin accounts for the periods indicated:
Reg. T Update
Here are the composite net returns for the Reg. T accounts for the periods indicated:
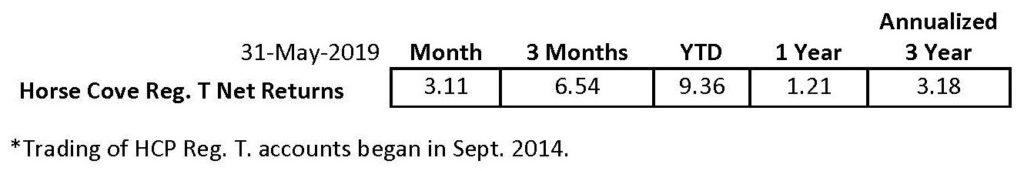
IRA accounts must use Reg. T Margin which means that fewer option contracts may be written than in the “regular” accounts that use Portfolio Margin. Over time, this may also result in lower returns when compared to the “regular” accounts.
HC Enhanced Yield Update
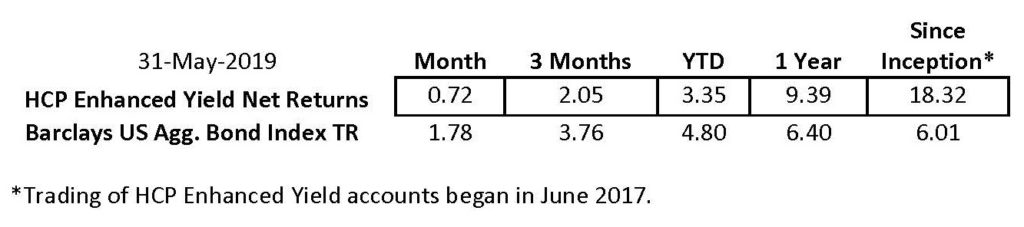
Here are the composite net returns for the Enhanced Yield Strategy for the periods indicated:
The Value of Non-Correlation
Portfolio diversification is at the bedrock of sound financial management and a major component of diversification is non-correlation between asset classes in a portfolio. Correlation is the tendency of things to move in a similar manner.
In the finance and investment industries, correlation is a statistic that measures the degree to which two securities move in relation to each other. Correlations are used in advanced portfolio management, computed as the correlation coefficient, which has a value that must fall between -1.0 and +1.0. https://www.investopedia.com/terms/c/correlation.asp
If two investments move perfectly with one another they have a correlation factor of +1.0. If they move in exact opposites, they have a perfect negative correlation represented by a correlation factor of -1.0. Non-correlation of two assets is represented by 0, meaning there is no relationship between the returns of one investment or asset class versus the other.
Since the beginning of trading in December 2010 through May 2019, the correlation coefficient of Horse Cove Partners Absolute Return strategy to the S&P 500 Total Return is 0.152. For the Enhanced Yield Strategy, it is 0.238 versus the Barclays US Agg. Bond Index Total Return. In recent years correlations among asset classes have tightened and, as we saw in 2008, bonds no longer offer opposite performance to equities during times in which investors want it most.
Devoting a portion of your investment portfolio to a strategy that is not correlated to other assets has the effect of lowering the overall risk while boosting its long-term return. This can be seen by what just happened in May. Horse Cove Partners not only outperformed the S&P 500, but it also delivered positive returns when the S&P was negative. When most large investment indexes (stock, real estate, commodities) are at or near all-time highs, and many small to medium sized fires are blazing behind the curtain, finding a place for a portion of your assets that has the potential to be positive when other major asset classes are negative is a smart, if not necessary, action.
Over the years, Horse Cove has delivered positive returns in both up and down markets and our non-correlation bears that out.
About Horse Cove Partners LLC
Profiting from the art and science of taking risk. ®
Horse Cove Partners was founded by Sam DeKinder and Kevin Ellis in January of 2013 with the commitment to help grow client’s assets with a highly disciplined investment strategy, replicated weekly, to extract absolute returns from the market by trading short volatility option spreads. The firm was launched after more than two years of trading experience with personal assets that began in December 2010. The firm is built on the strength of hedge fund trading expertise developed beginning in 2002.
Assets under management at the end of May 2019 were $104.58 million.“We do not believe we are smarter than the market, nor can we time the market in any given week or month. As a result, we take an investment approach similar to an insurance company in that our investment strategy focuses on the probability of success and the management of risk. We believe that it is possible to realize positive returns through a disciplined focus on the risk of each trade with a weekly investment horizon, and accepting intelligent losses when risk events occur.”
We thank you for your continued support.
Sincerely,
Sam DeKinder, Kevin Ellis
Greg Brennan
Fiona Dyer
John Monahan
Michael Crissey
Don Trotter
sdekinder@horsecovepartners.com
kellis@horsecovepartners.com
gbrennan@horsecovepartners.com
fdyer@horsecovepartners.com
jmonahan@horsecovepartners.com
mcrissey@horsecovepartners.com
dtrotter@horsecovepartners.com
Horse Cove Partners LLC
1899 Powers Ferry RD SE
Suite 120
Atlanta, GA 30339
678-905-5723 main
1Net estimate on a consolidated basis of similar accounts as of 5.31.2019, which is preliminary and subject to revision. Performance estimate described herein as “YTD” are net of fees and expenses including a 2% per year management fee and 20% incentive fee and assumes investors have been invested the entire time with no withdrawals. Individual account returns may vary depending on cash flows, the time period assets are invested, and restrictions placed on the account.
This was prepared by Horse Cove Partners LLC a federally registered investment adviser under the Investment Advisers Act of 1940. Registration as an investment adviser does not imply a certain level of skill or training. The oral and written communications of an adviser provide you with information about which you determine to hire or retain an adviser. Additional information about our firm is also available at www.adviserinfo.sec.gov. You can view the firm’s information on this website by searching by our firm name.
THIS MESSAGE AND ANY FILES TRANSMITTED WITH IT ARE CONFIDENTIAL AND PRIVILEGED. IF YOU ARE NOT THE INTENDED RECIPIENT, PLEASE NOTIFY THE SENDER IMMEDIATELY AT 1 (678) 905 5723. IF YOU ARE NOT THE NAMED ADDRESSEE YOU SHOULD NOT COPY OR DISCLOSE THE CONTENT OF THIS MESSAGE AND ANY FILES TRANSMITTED WITH IT TO ANY OTHER PERSON.
Internet communications are not secure and subject to possible data corruption, either accidentally or on purpose, and may contain viruses. The content of this message should not be construed as investment advice unless explicitly stated as such in the text of this message. Further, this message should not be construed as the solicitation of an offer to purchase or an offer to sell any securities or other financial instruments, including, without limitation, interest in any private investment managed by Horse Cove Partners LLC or any of its affiliated entities.
This material has been prepared solely for informational purposes only. Strategies shown are speculative, involve a high degree of risk and are designed for sophisticated investors.
Past performance is not a guarantee of future results. Investing involves risk, including the possible loss of principal and fluctuation of value. The information herein was obtained from third-party sources. Horse Cove does not guarantee the accuracy or completeness of such information provided by third parties. All information is given as of the date indicated and believed to be reliable. Performance results are estimates pending a verification. The returns are based on the Investment Manager's strategy and the compilation of actual client account trades. The Horse Cove Absolute Return and IRA Return strategies seek to extract absolute returns from the market by trading short volatility option spreads. The Enhanced Yield strategy seeks to achieve a targeted return trading only puts with a high probability of success.
The strategies reflect the deduction of advisory fees and any other expenses that a client would have paid or actually paid. The S&P 500 Index is used for comparative purposes only. The volatility of an index is materially different from that of the model portfolio. The S&P 500 refers to the Standard and Poor's 500 Index which is a capitalization-weighted index of 500 stocks. The index is designed to measure the performance of the broad domestic stock market. The VIX (CBOE volatility index) is the ticker symbol for the Chicago Board Options Exchange (CBOE) Volatility Index, which shows the market's expectation of 30-day volatility. It is constructed using the implied volatilities of a wide range of S&P 500 index options. This volatility is meant to be forward looking and is calculated from both calls and puts. The VIX is a widely used measure of market risk and is often referred to as the "investor fear gauge." Investors cannot invest directly in an index. An index does not charge management fees or brokerage expenses, and no such fees or expenses were deducted from the performance shown. Options trading entails a high level of risk. The models do not include the reinvestment of dividends and capital gains because options don't pay dividends. Please read the Characteristics and Risks of Standardized Options available from the Options Clearing Corporation website: http://www.optionsclearing.com for further details.

